PTI hoof and foot icon
divider

PTI Torch Power Output/ Energy Density

PTI Torch Power Output/ Energy Density mW/cm2

Actual “real world” Energy Densities after exiting optics is about 30% of that at Emitter Surface. Use that # for dosing calculations.

Photopuncture Torch

TTL mW Output per second

mW/cm² per second

Joules delivered
per minute per cm²

Time to deliver 1 Joules per cm² (in seconds)

Time to deliver 10 Joules per cm² (in seconds)

Time to deliver  30 Joules per cm² (in seconds)

Red+2 Torch – High

1002

167

10.02

6

60

180

Red+2 Torch High – Telescoped

334

20.04

3

30

90

Red+2 Torch – High – Fiber-Optic Probe


2004

120.24

0

5

15

Red+2 Torch – Low

171

29

1.71

35

351

1,053

Red+2 Torch Low – Telescoped

57

3.42

18

175

526

Red+2 Torch – Low – Fiber-Optic Probe

342

20.52

3

29

88

Red+2 Torch – Pulsed

533

89

5.33

11

113

338

Red+2 Torch – Pulsed – Telescoped

178

10.66

6

56

169

Red Torch+ – Pulsed – Fiber-Optic Probe

1066

63.96

1

9

28

Red Torch – High

612

102

6.12

10

98

294

Red Torch High – Telescoped

204

12.24

5

49

147

Red Torch – High – Fiber-Optic Probe

1224

73.44

1

8

25

Red Torch – Low

150

25

1.5

40

400

1,200

Red Torch Low – Telescoped

50

3

20

200

600

Red Torch Low – Fiber-Optic Probe

300

18

3

33

100

Red Torch – Pulsed 

318

53

3.18

19

189

566

Red Torch – Pulsed – Telescoped

106

6.36

9

94

283

Red Torch – Pulsed – Fiber-Optic Probe

636

38.16

2

16

47

Amber Torch – High

341

57

3.41

18

176

528

Amber Torch High – Telescoped

114

6.82

9

88

283

Amber Torch – High – Fiber-Optic Probe

682

40.92

1

15

47

Amber Torch – Low

101

17

1.01

59

594

1,782

Amber Torch Low – Telescoped

34

2.02

30

297

891

Amber Torch – Low – Fiber-Optic Probe

202

12.12

5

50

149

Amber Torch – Pulsed

171

28

1.705

35

352

1,056

Amber Torch – Pulsed – Telescoped

57

3.41

18

176

528

Amber Torch – Pulsed – Fiber-Optic Probe

341

20.46

3

29

88

Green Torch – High

218

36

2.18

28

275

826

Green Torch High – Telescoped

73

4.36

14

138

413

Green Torch – High – Fiber-Optic Probe

436

26.16

2

23

69

Green Torch – Low

56

9

0.56

107

1,071

3,214

Green Torch Low – Telescoped

19

1.12

54

536

1,607

Green Torch – Low – Fiber-Optic Probe

112

6.72

9

89

268

Green Torch – Pulsed

109

18

1.09

55

550

1,651

Green Torch – Pulsed – Telescoped

36

2.18

28

275

826

Green Torch – Pulsed – Fiber-Optic Probe

218

13.08

5

46

138

Blue Torch – High

449

75

4.49

13

134

401

Blue Torch High – Telescoped

150

8.98

7

67

200

Blue Torch – High – Fiber-Optic Probe

898

53.88

1

11

33

Blue Torch – Low

103

17

1.03

58

583

1,748

Blue Torch Low – Telescoped

34

2.06

29

291

874

Blue Torch – Low – Fiber-Optic Probe

206

12.36

5

49

146

Blue Torch – Pulsed

225

38

2.25

27

267

800

Blue Torch – Pulsed – Telescoped

75

4.5

13

133

400

Blue Torch – Pulsed – Fiber-Optic Probe

450

27

2

22

67

To calculate Dose in J/cm2 for Photopuncture Torch at “0” Distance (directly touching Treatment Area)

At “0” Distance, Photopuncture Torch Energy Density = 375 mW/cm2

375 mW/cm2 = .375 W Multiply by exposure in seconds for dose in J/cm2 Ex: .375 W x 15 secs = 5.625 J/cm2 Dose


Calculate Dosage for Photopuncture Torch at other distances from Treatment Area

at 1″ Distance = 2 1/4″ Beam Width Energy Density = 50 mW/cm2 2″ Distance = 3 1/2″ Beam Width Energy Density = 20 mW/cm2

50 mW/cm2 = .05 W Multiply by exposure in seconds for dose in J/cm2 Ex: .05 W x 90 secs = 4.5 J/cm2 Dose .02 W x 200 secs = 4 J/cm2 Dose


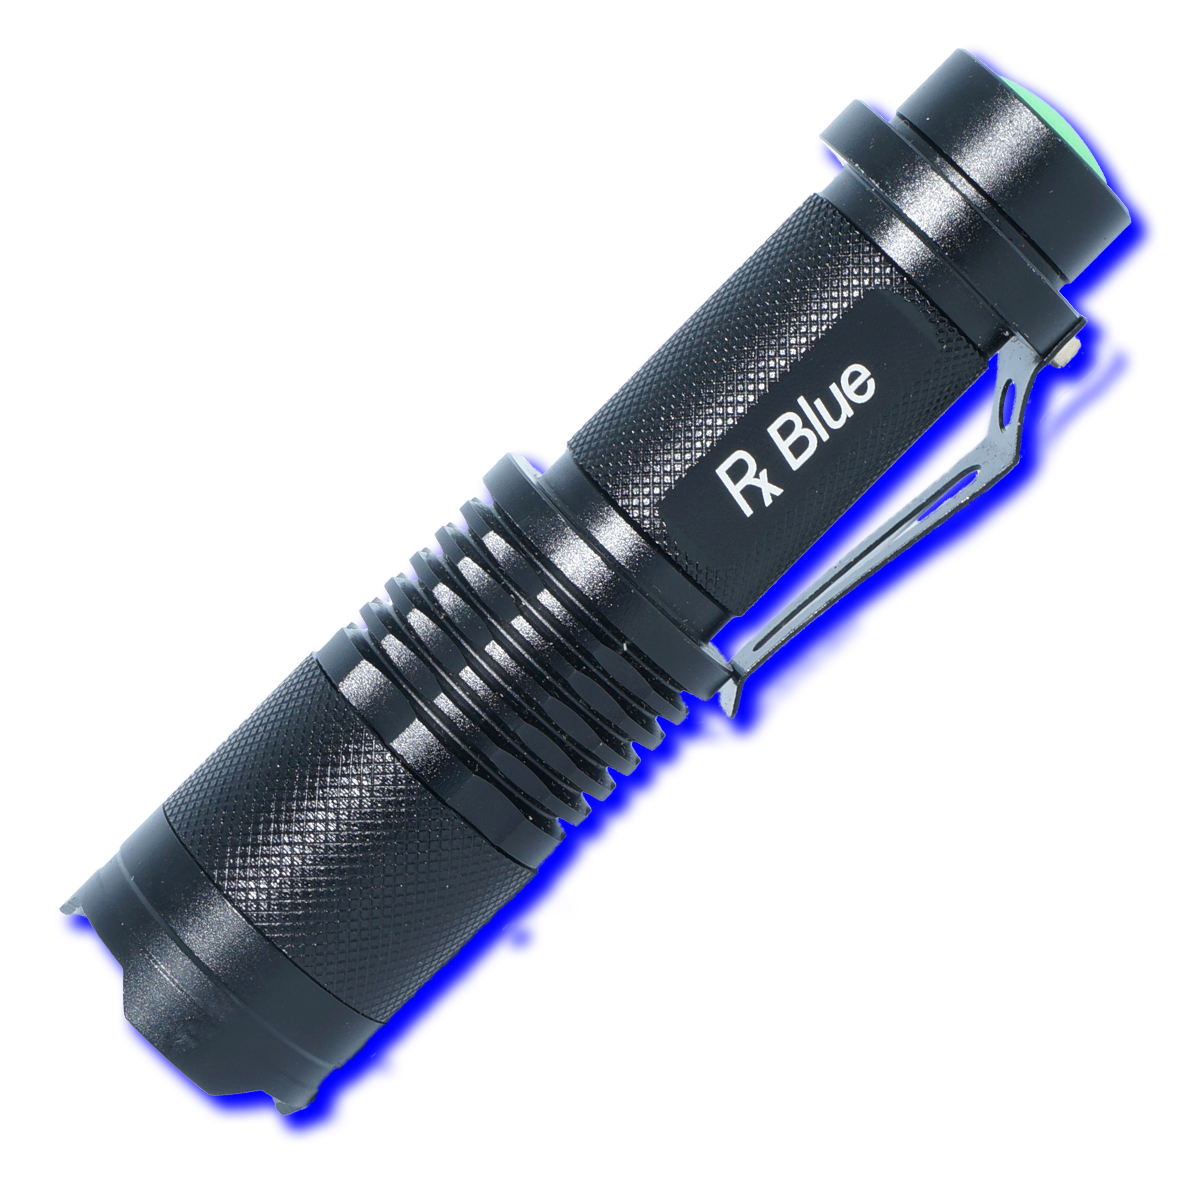
The Photopuncture Torch also has a “Zoom” feature.

At the Maximum zoom setting you can use the following Energy Densities to calculate Dosage: Photopuncture Torch beam
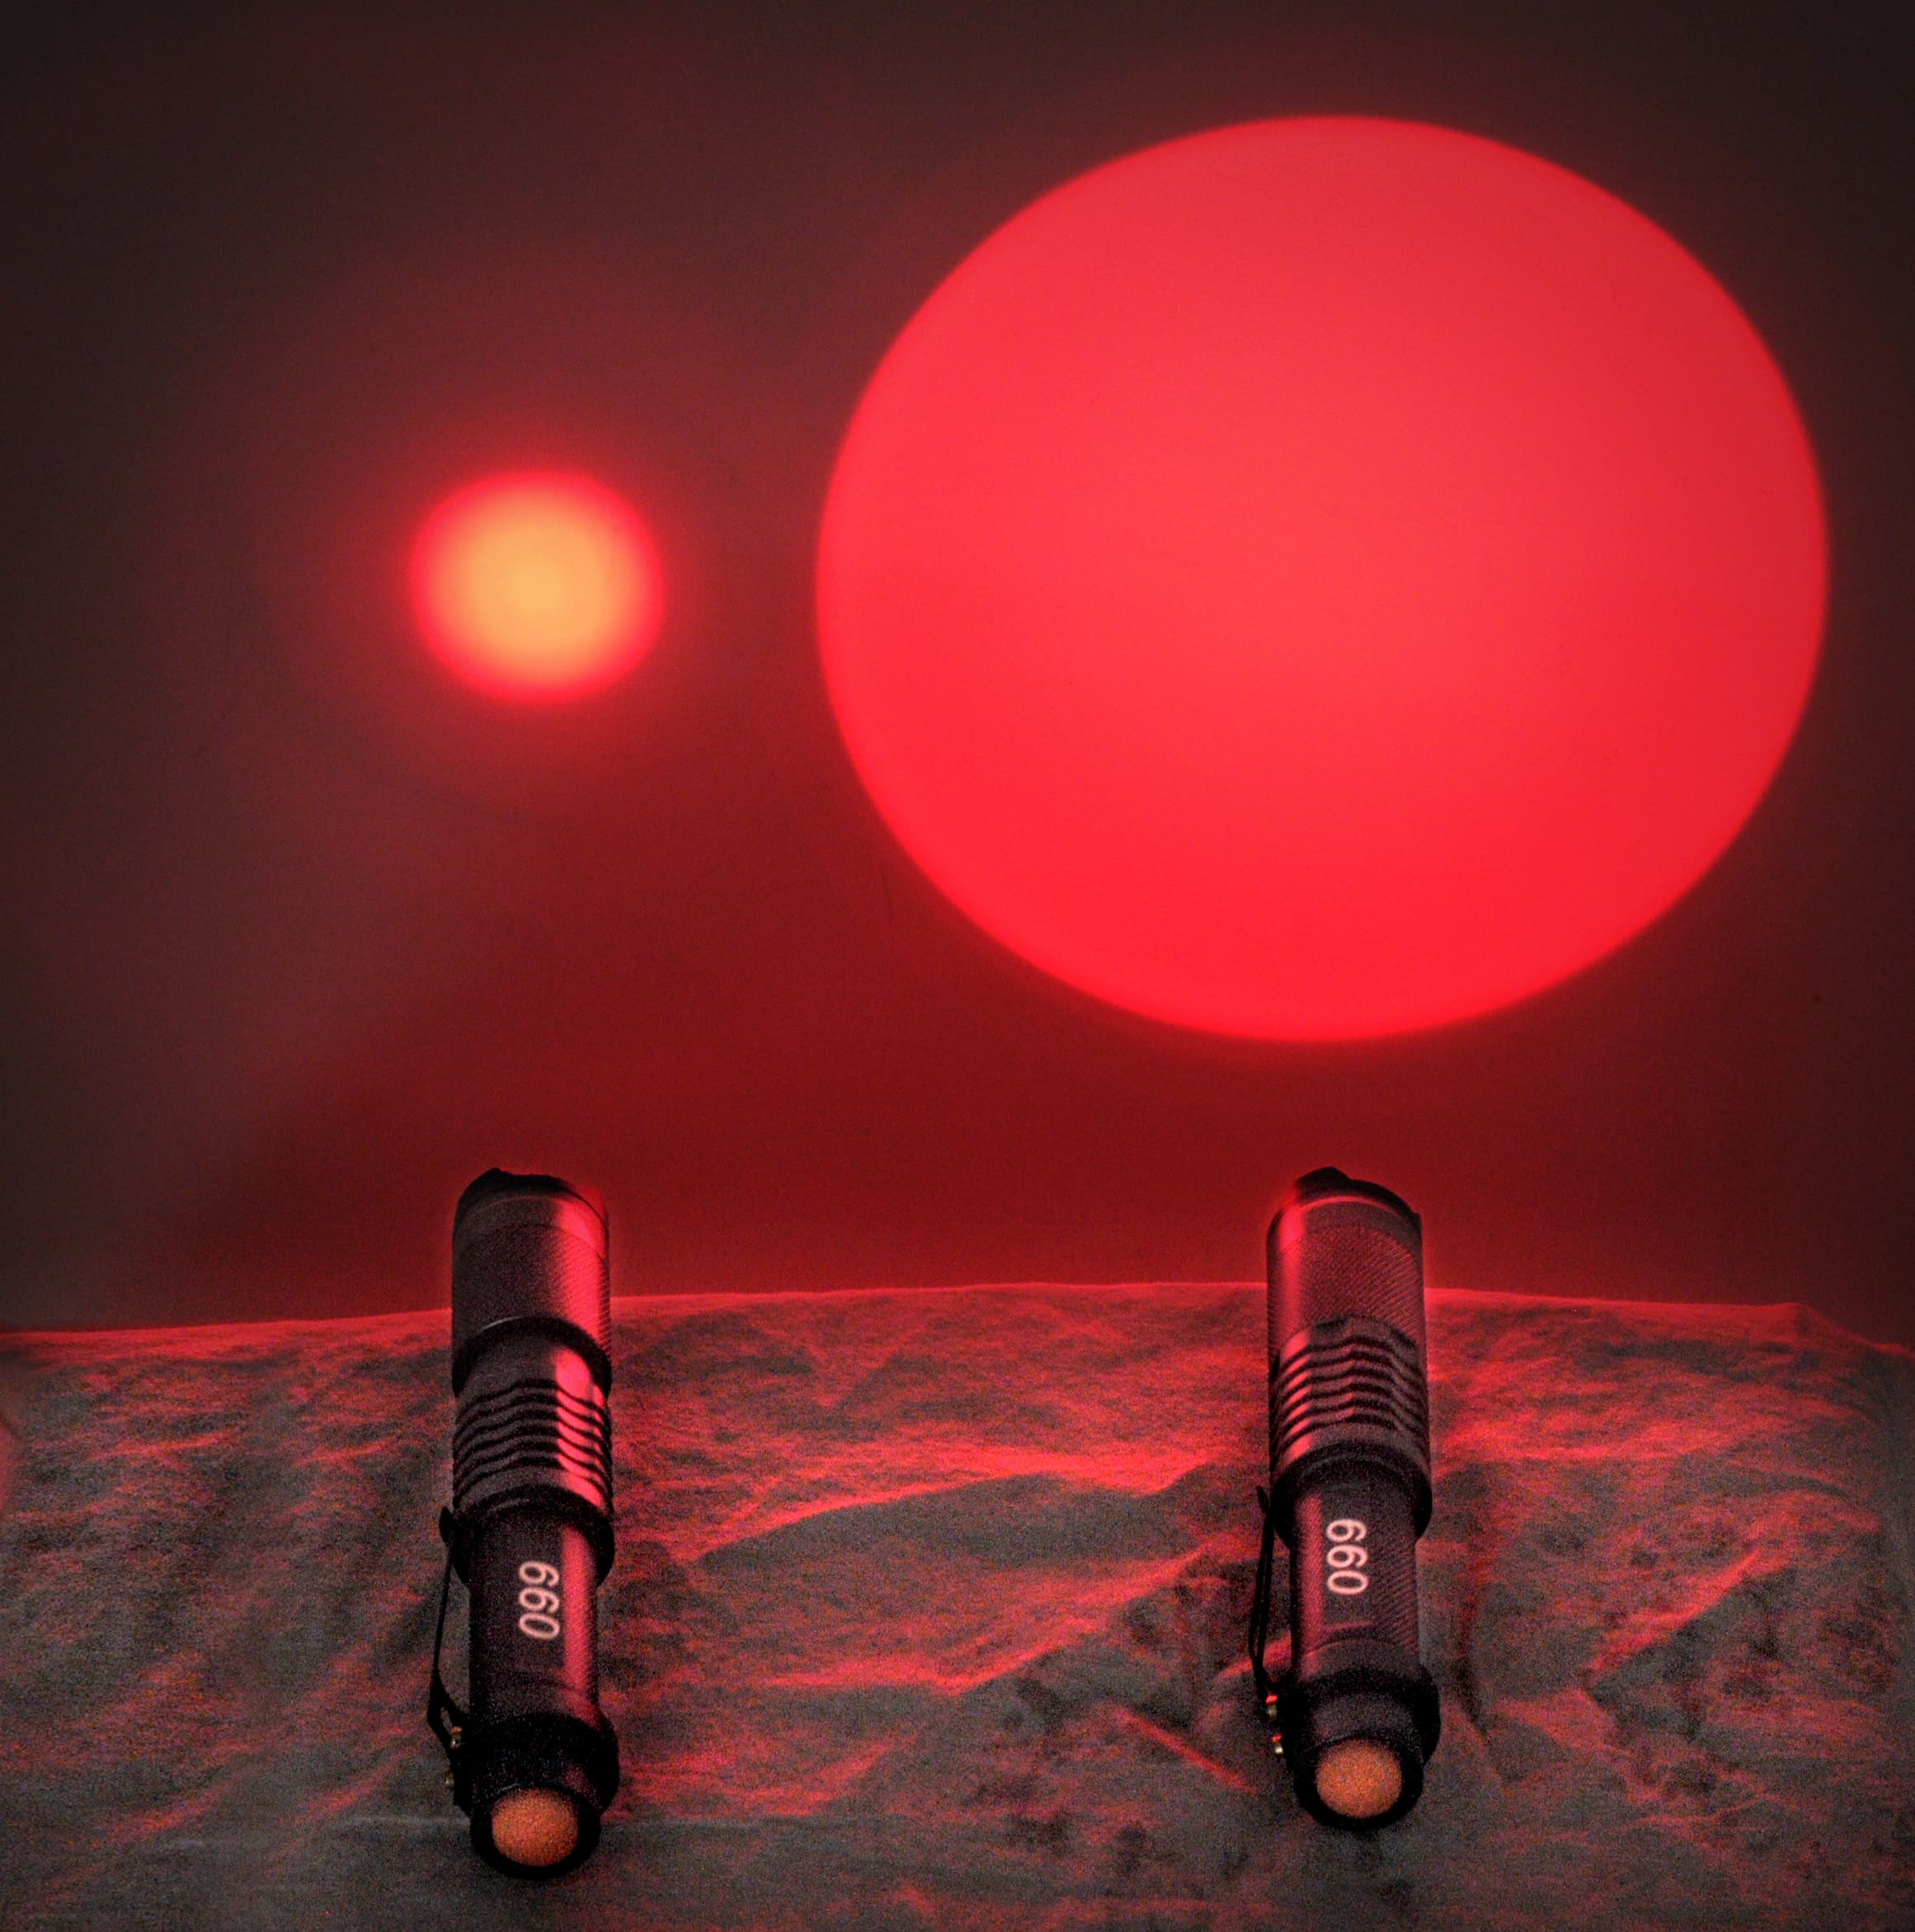
at 4″ Distance = 1 1/4″ Beam Width Energy Density = 66 mW/cm2 3″ Distance = 1 1/8″ Beam Width Energy Density = 67 mW/cm2 2″ Distance = 1″ Beam Width Energy Density = 70 mW/cm2 1″ Distance = 1″ Beam Width Energy Density = 75 mW/cm2

Example: 2″ Distance (Max Zoom) Energy Density = 70 mW/cm2 = .07W .07 W x 60 secs = 4.2 J/cm2 Dose
Looking at some of the Power Outputs being claimed by various manufacturers of LED Red Light Therapy Units, it’s obvious that there are a lot of inaccurate claims being made.  Most Vendors publish their units Power Consumption numbers (instead of their Power Output in mW/cm2) which not only are misleading high, but totally irrelevant in terms of dosing. Other Vendors typically measure their units Power Output at the Emitter surface (right up against the actual LED), to claim numbers about 3x higher than the actual output thru their optical system. Considering the lights are not used without their optics in place, those numbers would be useless to calculate dosing. In an effort to avoid hype and provide accurate, reality based numbers to calculate dosing, we had our torches independently with and without the Fiber-Optic Probe attachment (on the HIGH mode) for actual Power Output (Energy Density) in mW/cm2 with integrated sphere testing that counts all photons being emitted by a device.

Tool or Pad Name

Output Wavelengths

Illumination Area (cm2)

Average Output Density
mW/cm2/second

Joules per cm2
per minute

Joules per cm2
per 20 minutes

Podiatric Boot 122 – Red/NIR

630nm Red, 850nm NIR

479

11

.07

13.3

Body 264 Pad – Red/NIR

630nm Red, 850nm NIR

361

30

1.8

36.5

Body 264 Pad – Tricolor

470nm Blue, 630nm Red, 850nm NIR

361

30

1.8

36.5

T-Pad 263 – Red/NIR

630nm Red, 850nm NIR

337

35

2.1

42.5

Body 264 Pad – Blue/NIR

470nm Blue, 850nm NIR

316

30

1.8

36.5

Painbuster II 180 – Red/NIR

630nm Red, 850nm NIR

315

24

1.4

29

Painbuster II 180 – Blue/NIR

470nm Blue, 850nm NIR

315

24

1.4

29

Painbuster II 180 – Tricolor

470nm Blue, 630nm Red, 850nm NIR

215

24

1.4

29

Local 132 – Red/NIR

630nm Red, 850nm NIR

184

30

1.8

35.8

Local 132 – Tricolor

470nm Blue, 630nm Red, 850nm NIR

184

30

1.8

35.8

Local 132 – Blue/NIR

470nm Blue, 850nm NIR

184

30

1.8

35.8

Painbuster 90 – Red/NIR

630nm Red, 850nm NIR

136

28

1.7

33.5

Facemask

470nm Blue, 630nm Red

100

5

.3

6.2


InLight Pads Output - per pad

Tool or Pad Name

Output Wavelengths

Illumination Area (cm2)

Average Output Density
mW/cm2/second

Joules per cm2
per minute

Joules per cm2
per 20 minutes

Podiatric Boot 122 – Red/NIR

630nm Red, 850nm NIR

479

11

.07

13.3

Body 264 Pad – Red/NIR

630nm Red, 850nm NIR

361

30

1.8

36.5

Body 264 Pad – Tricolor

470nm Blue, 630nm Red, 850nm NIR

361

30

1.8

36.5

T-Pad 263 – Red/NIR

630nm Red, 850nm NIR

337

35

2.1

42.5

Body 264 Pad – Blue/NIR

470nm Blue, 850nm NIR

316

30

1.8

36.5

Painbuster II 180 – Red/NIR

630nm Red, 850nm NIR

315

24

1.4

29

Painbuster II 180 – Blue/NIR

470nm Blue, 850nm NIR

315

24

1.4

29

Painbuster II 180 – Tricolor

470nm Blue, 630nm Red, 850nm NIR

215

24

1.4

29

Local 132 – Red/NIR

630nm Red, 850nm NIR

184

30

1.8

35.8

Local 132 – Tricolor

470nm Blue, 630nm Red, 850nm NIR

184

30

1.8

35.8

Local 132 – Blue/NIR

470nm Blue, 850nm NIR

184

30

1.8

35.8

Painbuster 90 – Red/NIR

630nm Red, 850nm NIR

136

28

1.7

33.5

Facemask

470nm Blue, 630nm Red

100

5

.3

6.2


Visum Light Ouput

Tool Name

Output Wavelengths

Average Output Density
mW/cm2/second

Joules per cm2
per minute

Joules per cm2
per 20 minutes

dpl Flex Pad

660nm Red, 890 NIR

4.7

.28

5.6

MyElle Vaginal Wand

Red Microlight

660nm Red

.5

.03

.6

RevitaVet Poll Cap


Scroll to Top